Liquidity fuels markets, and globally, the US dollar remains pre-eminent. This year as bond yields and the dollar rose, dollar liquidity has declined. Stubborn inflation and robust GDP data led to delayed interest rate cuts, tightening financial conditions, and choking the inflows which gave risk assets their 2023 year-end joyride.
The US economy re-accelerated in 2023, as loose US fiscal policy overpowered tight monetary policy. Who knew that putting your feet simultaneously on the brake and accelerator could lead to unexpected results? However, the current economic data still suggest growth, albeit with significant sector variations.
Last year, markets feared the term risk in US bank balance sheets. This year, the threat has shifted to credit risk. This time, the Fed can’t just open a discount window and pretend everything is fine. Repurchasing long-dated Treasury bonds bought at the wrong price is one thing; offering office blocks for repurchase, quite another. There comes a point where even the Fed has to admit that rate cuts are the only solution.
The copper-to-gold price ratio measures investors’ propensity for greed over fear and selling gold to buy copper represents a useful proxy for buying the China recovery. War in Ukraine and the regional bank crisis sent investors scrambling for gold, but prospect of global economic recovery should boost this ratio as the animal spirits kick in. However, China’s slowing fragile economy and Europe’s enduring economic coma restrain inflows.
January’s long-fought Bitcoin ETF approval stimulated investor interest. Although, ETF’s convenience and low-cost structure were unlikely to be an overnight success, there is growing evidence that flow previously destined for gold ETFs are now diverting to BTC. With Bitcoin’s market value at just 8% of gold’s, this trend can travel further as Bitcoin moves into the mainstream.
But Bitcoin ETF adoption started more slowly than the enthusiasts expected. Legacy Bitcoin alternatives like the more expensive Grayscale Bitcoin Trust saw outflows as its discount narrowed and cheaper alternatives became available. These outflows sparked a 20% BTC price drop. However, ETF inflows gained traction, and by early February the Grayscale outflows faded and the Bitcoin price recovered.
Steady BTC inflows can still be overcome. Debris from the ‘crypto winter’ remain. For example, liquidators of the bankrupt Genesis Global have yet to sell its $1.4bn Bitcoin holding. On the other hand, April’s halving cuts the daily supply just as an army of financial advisors begins to recommend Bitcoin ETF allocations to Middle America’s mass affluent. The underlying trend looks bullish, particularly if past cycles are any guide.
While we know that past performance should not be our future guide, Bitcoin does have a hard to ignore history of post-halving price surges. In 2013, the price soared 89x; later cycles in 2017 and 2021 saw price moves of 27x and 7x, respectively. Will 2025 see a new all-time high for BTC and keep this cycle alive? Let’s consider the risks and opportunities.
The historic sample size of just three prior halving events may not be statistically significant. And the post-halving gains are getting smaller. However, ETFs have arrived, Bitcoin is accessing new sources of demand. Note that the gold price increased 3-fold in the five years after State Street launched the first US gold ETF in 2004. History might not be on repeat, but rhyming would be sufficient.
Yet for many, Bitcoin is just a scam or a tool for criminals, despite this ‘no use case’ network withstanding 15 years of attacks, setbacks, and regulatory hurdles. Like the internet, the pearl-clutching mainstream has dismissed and denounced it as just a hobby interest with subversive tendencies. However, the BTC network is being more widely adopted, displaying what Taleb calls antifragility. Let’s see how.
The Bitcoin network is growing from the ground up. Like the internet boom, the crypto boom lured in a wave of VC investment capital, and much of which went up in smoke. However, Bitcoin ‘layer-two’ emerged from the chaos, significantly improving practical consumer acceptance, especially in regions where currencies tend to hyper-inflate. Authors like Alex Gladstein with Check Your Financial Privilege and Lyn Alden with Broken Money document how Bitcoin offers a lifeline to the world’s unbanked poor in Latin America and Africa. It is also being adopted to monetise pockets of trapped energy, an increasing feature of today’s power grids. Exxon, among others, mines Bitcoin from trapped gas deposits in North Dakota.
Meanwhile, in equities, dollar liquidity continues to inflate the AI bubble. Nvidia just overtook Amazon and Alphabet in re-ordering the world’s largest companies. But the bubble is also spreading. While giants like Tesla and Apple lag, lesser-known players like ARM and Super Micro have skyrocketed. Even RELX, listed on the UK’s outmoded stock market, is getting an AI boost. Liquidity, it seems, can even awaken the presumed dead.
Remember the dot.com boom? Then, you will recall when Cisco was its one-minute wonder. But as the bubble spread investors rushed into any dot.com stock or company that launched a website. Cisco remained prominent, but equity valuations dispersed. If Nvidia is today’s Cisco, just as water finds cracks, expect the AI bubble to leak into lower capitalisation stocks. The impact can be spectacular. A tiny fraction of Nvidia’s $1.8tn market value flowing into UK data or technology companies may yet deliver yacht money to management teams and their investors. You have been warned!
Written by Jeremy McKeown
Jackson’s Chart: COPPER WEEKLY (An Analysis by Jackson Wray)
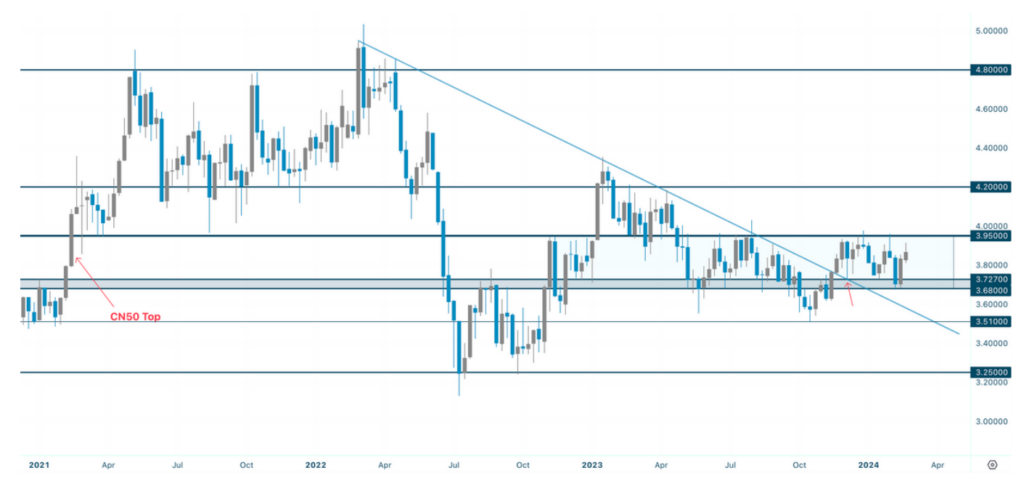
Explanation
When we last looked at Copper in issue 3 (August 23), price was rangebound between $3.68 & $3.95 consolidating into a tight area of significance. Since then, we have broken the descending trend line which formed from the high in 2022, with multiple rejections of both support and resistance being experienced. An interesting point to note, is the importance of the Chinese market on the Copper price historically. If you look at where price was in February 2021, where we had the CN50 high, you can see Copper is trading at a very similar level to then with the CN50 down 42%. This suggests Copper has remained resilient in difficult macro conditions, and by looking at the chart and relative terms, this sideways price action has been impressive. If you combine the technical setup with a contracting supply and potential improvement in conditions, Copper is certainly a commodity to keep an eye on.
Further Reading & Listening:
DISCLAIMER
This is for information purposes only and is not to be considered as advice in any form, including but not limited to investment, accounting, tax, legal or regulatory advice. The information does not take into account a persons specific investment objectives, financial situation or particular needs of any specific recipient. Opinions expressed are our current opinions as of the date appearing on the document only.
Any working examples, forecasts or data are for illustrative purposes only. Dowgate Wealth does not make representation that the information provided is appropriate for use in all jurisdictions or by all Investors or other potential Investors. Parties are therefore responsible for compliance with applicable local laws and regulations. Dowgate Wealth will not be held liable for any loss or damage resulting directly or indirectly from the use of any information on this site.