In a global context, UK equities remained sluggish in Q1 2024, with domestic indices showing low single-digit changes compared to high single-digit or low double-digit gains for indices in the US, Japan, and China. Unusually, these equity market gains came despite higher US and UK 10-year bond yields, which rose by about 60 bps.
While central banks have stuck to the narrative that policy rates have peaked, a stronger than expected US economy and an emerging Chinese manufacturing recovery have pushed expected rate cuts into the second half of the year. If 2023 was the year markets adopted the idea of a US soft landing, 2024 could be the year of the no-landing hypothesis. With robust US GDP and jobs data, there is waning economic justification for rate cuts, and the question for the Bank of England and the ECB (where there is a case to cut) is whether they are prepared to lead the Fed.
A Fed rate cut in an election year with an economy growing at +3% pa and creating over 300,000 jobs monthly looks like a political act. Doubt regarding central bank independence increases fears of US Treasury debt monetisation. Such concerns have pushed precious metal prices and bond yields higher simultaneously, confusing commentators and raising concerns of radical uncertainty. China has been switching its reserve assets from Treasuries to gold bullion for some time, action consistent with plans for a currency devaluation or a military campaign.
Other commodity prices have also strengthened during the period. Oil is up 16%, with Brent Crude close to its 12-month high and above $90. Copper and other industrial metals have also risen, and a few soft commodities have spiked. Cocoa prices have nearly doubled YTD. While containable, these price moves come when retail inflation appears stubbornly sticky. We might not be heading for a 1970s-style double-headed surge, but fears of sustainably higher inflation persist.
Despite delayed rate cuts, yield curves are normalising as longer-duration yields increase, and bond wonks debate whether this implies a bull or bear steepening. The outcome will be determined by whether we can manage a manufacturing-led reflation (China’s recovery persists) before the long and variable lags of “higher for longer” start to break things. One doesn’t have to look far to find swathes of debt that require refinancing; Thames Water is just one example.
However, for equities, the high level of market concentration remains a feature, particularly the dominance of the Magnificent Seven AI Big Tech goliaths. A robust, fiscally stimulated US economy and growing evidence of a technological paradigm shift continued to pull markets higher from the top, albeit with less force. Although we have previously commented on this bubble-like trend, it is becoming more widely debated.
Knowing you are in a bubble is tricky until it is too late. Today’s tech titans have sounder financials than most of their dot-com equivalents, suggesting the AI bubble could still be in its formative stages. Era-defining bubbles, like those seen in 1929, 1973, and 2000 only collapse after they have sucked in all market participants. While we tell ourselves that we are not going to get sucked in, the dominance of passive index-tracking does much of it automatically.
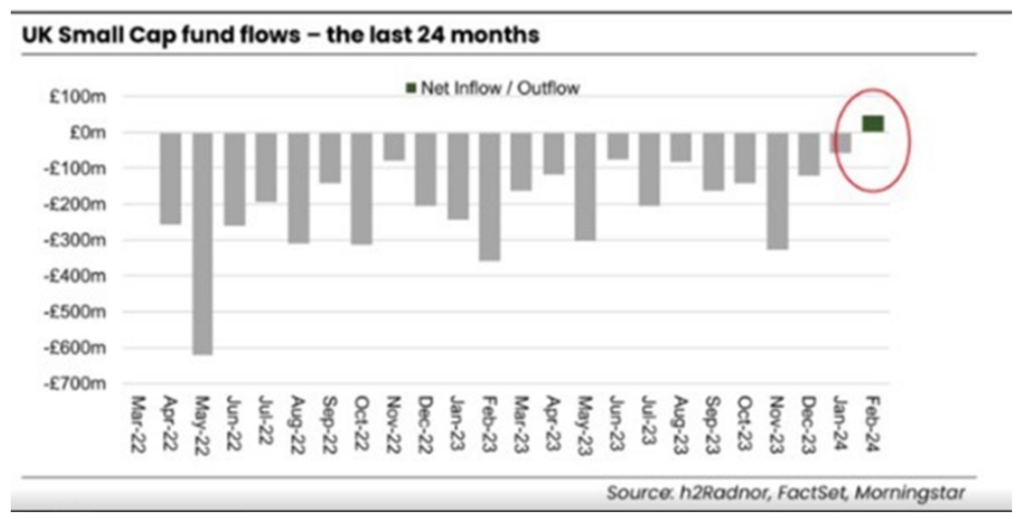
The timing of major trend reversals in equity markets is impossible to judge. However, history indicates that periods of extreme concentration led to multiyear returns to active and value styles, particularly in smaller companies. Although long-term equity market trends change slowly (at least initially), some encouraging early signs are present. In Q1 2024, flows to UK equity funds remained negative but at a declining rate, increasingly offset by increasing share buyback and M&A activity.
Notably, February witnessed the first net inflow into UK Small-Cap Funds for over two years. One swallow doesn’t make a Summer, but the idea that the UK is overdue an increased capital allocation is gaining wider traction. The suggestion by Shell that it is still considering the option of moving its listing to the US has not only flagged the UK’s cheapness compared to international peers and boosted its valuation, but it has also given itself the political room to pivot back to its core hydrocarbon development activity more quickly.
As UK-listed companies continue to retire their lowly valued equity through record levels of share buybacks and agree to offers at attractive valuation premia, the price action on increased capital flows to the lower echelons of this market will be dramatic. We have waited long enough!
Probably nothing.
Written by Jeremy McKeown
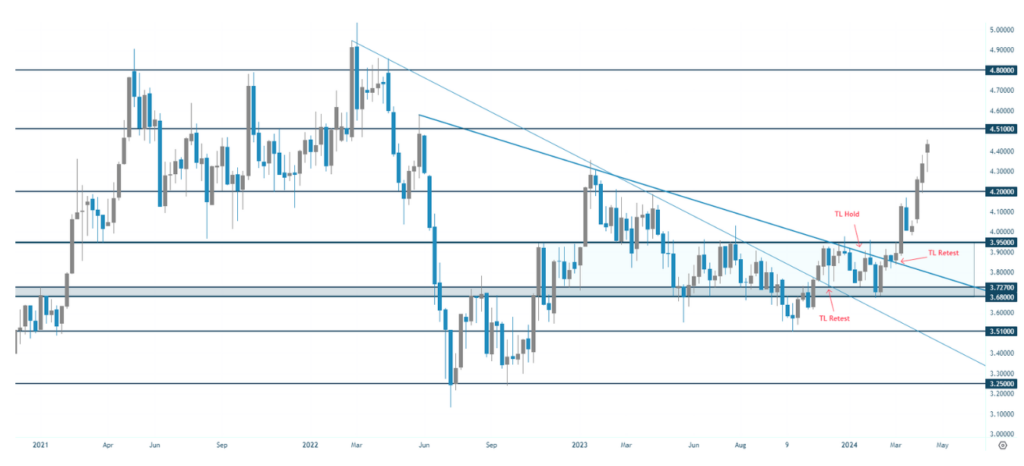
Jackson’s Chart: COPPER WEEKLY (An Analysis by Jackson Wray)
Explanation
Copper (Weekly) – In February, we covered the very interesting and rangebound spot Copper price (highlighted by the rectangular zone between $3,75 and $3.95). Since the break and retest of the longer term trendline highlighted previously price interacted with a second trendline which was held until the end of February. Price moved aggressively through the important $3.95 level and quickly moved to (and through) the next key area at $4.20. Although difficult to attribute this to one factor, the 13% CN50 rally preceded this move in Copper, and has seemingly given price the spark it needed overcome the resistance levels and range highlighted. With price now free from this wall of selling, price is gravitating towards $4.51 and $4.80 where the all time high is in sight. Considering the recovery in China, the well known supply imbalances and current momentum, this could be a matter of time if $4.51 is broken in same fashion as levels below.
Further Reading & Listening:
DISCLAIMER
This is for information purposes only and is not to be considered as advice in any form, including but not limited to investment, accounting, tax, legal or regulatory advice. The information does not take into account a persons specific investment objectives, financial situation or particular needs of any specific recipient. Opinions expressed are our current opinions as of the date appearing on the document only.
Any working examples, forecasts or data are for illustrative purposes only. Dowgate Wealth does not make representation that the information provided is appropriate for use in all jurisdictions or by all Investors or other potential Investors. Parties are therefore responsible for compliance with applicable local laws and regulations. Dowgate Wealth will not be held liable for any loss or damage resulting directly or indirectly from the use of any information on this site.